Alex MontesHomework 12I had an interesting time trying to figure out what type of charts to make for my data. I used data from the United States Department of…2 min read·Apr 29, 2021----
Alex MontesHomework 8I looked through a few of the data sets from other links that you provided — and liked the BLS data the best. I liked the fact that the…1 min read·Apr 14, 2021----
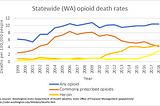
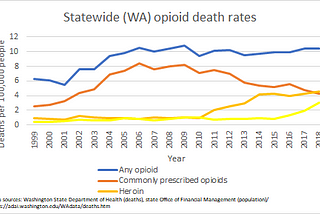
Alex MontesOPIOID CRISIS IN WASHINGTON STATE (YEARS: 1995–2020)This data was not too hard to find, however navigating through the data was more tricky. The data that I used was provided to me from the…2 min read·Mar 4, 2021----
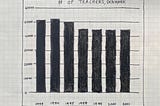
Alex MontesHomework #5, All the chart typesThis was my chart that I made out of a dataset from the University of Washington dataset that I put in my last medium post. Here is the…2 min read·Feb 24, 2021----
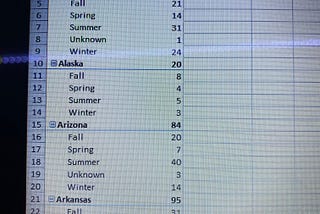
Alex MontesI didn’t know how to include my whole pivot table, but I took a few pictures of my work.For my midterm, my two ideas are looking into the demographics of drug usage in Washington state, also what type of drugs are used most. I…2 min read·Feb 17, 2021----
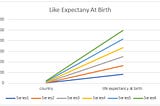
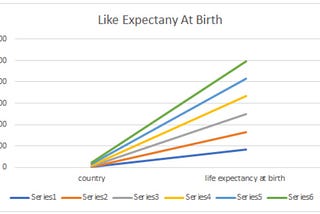
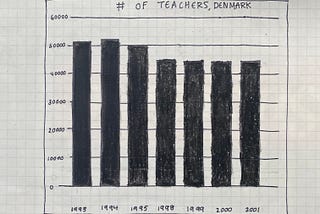
Alex MontesFor my chart I choose data from Denmark.Journalism Handbook: A takeaway I got from this article was that there are certain times that it is better to design with data, than to…2 min read·Feb 3, 2021----